
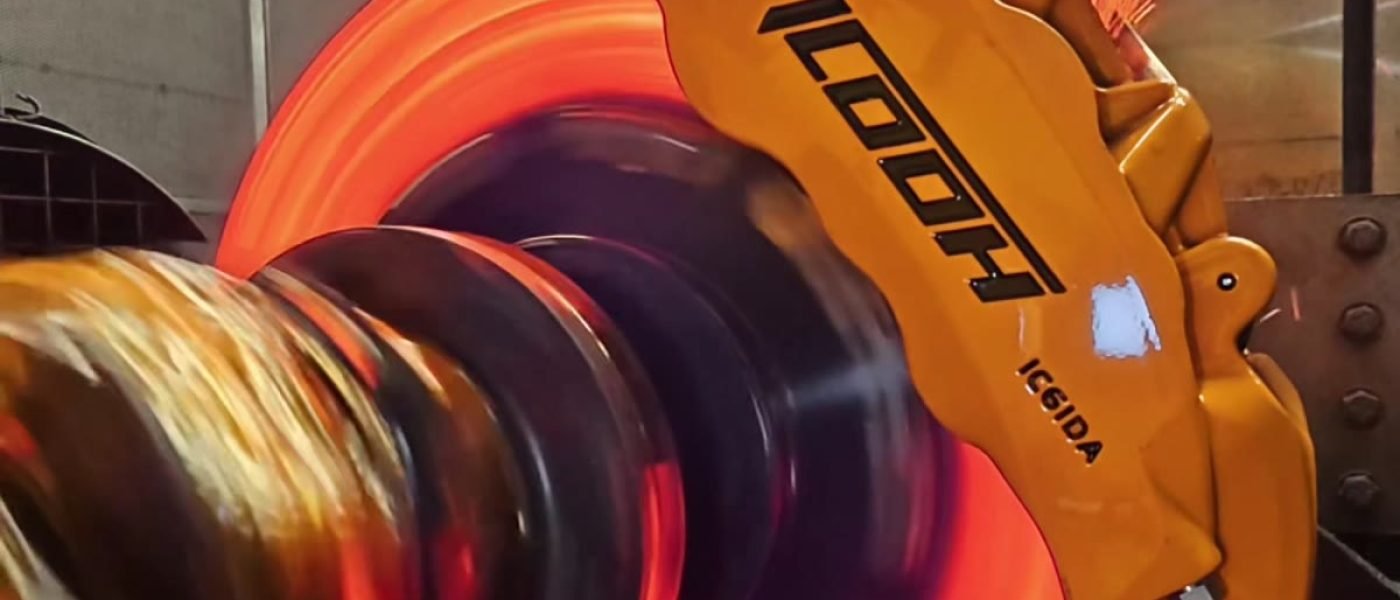
Sistemas de frenos 101 — Dynamometer Test Data
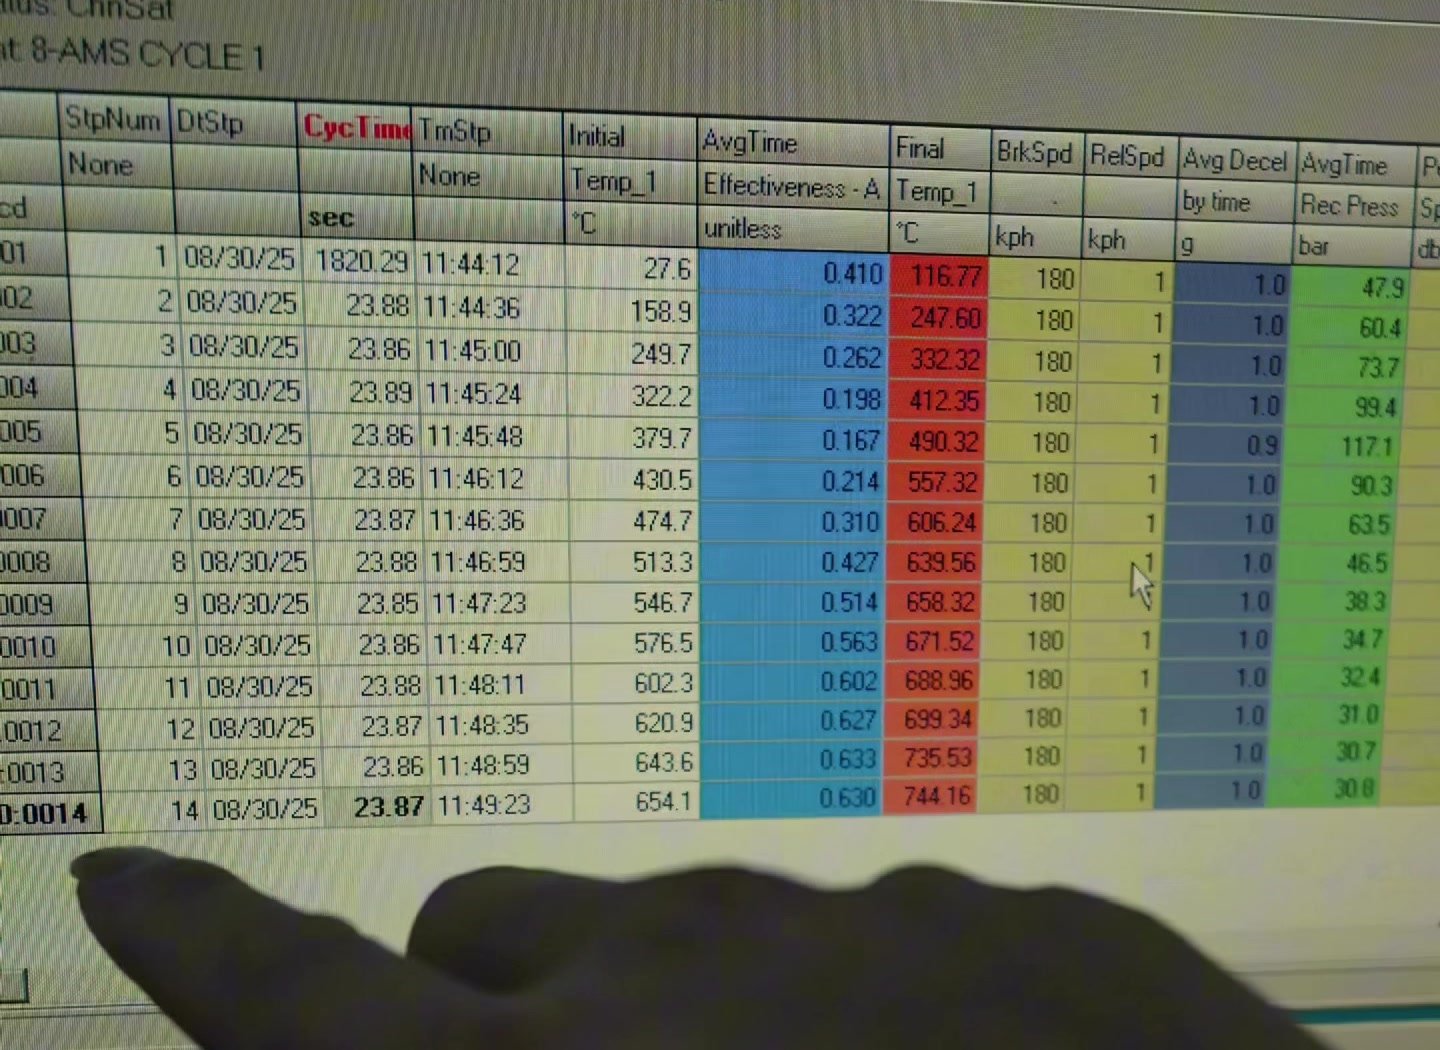
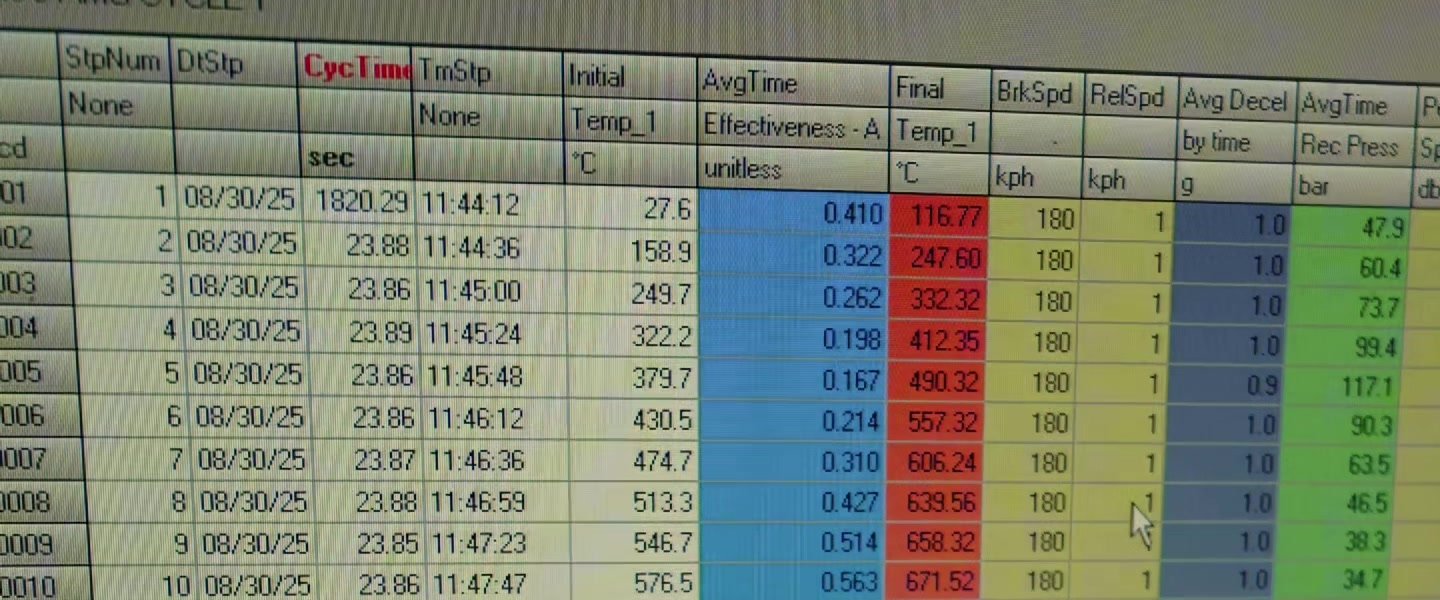
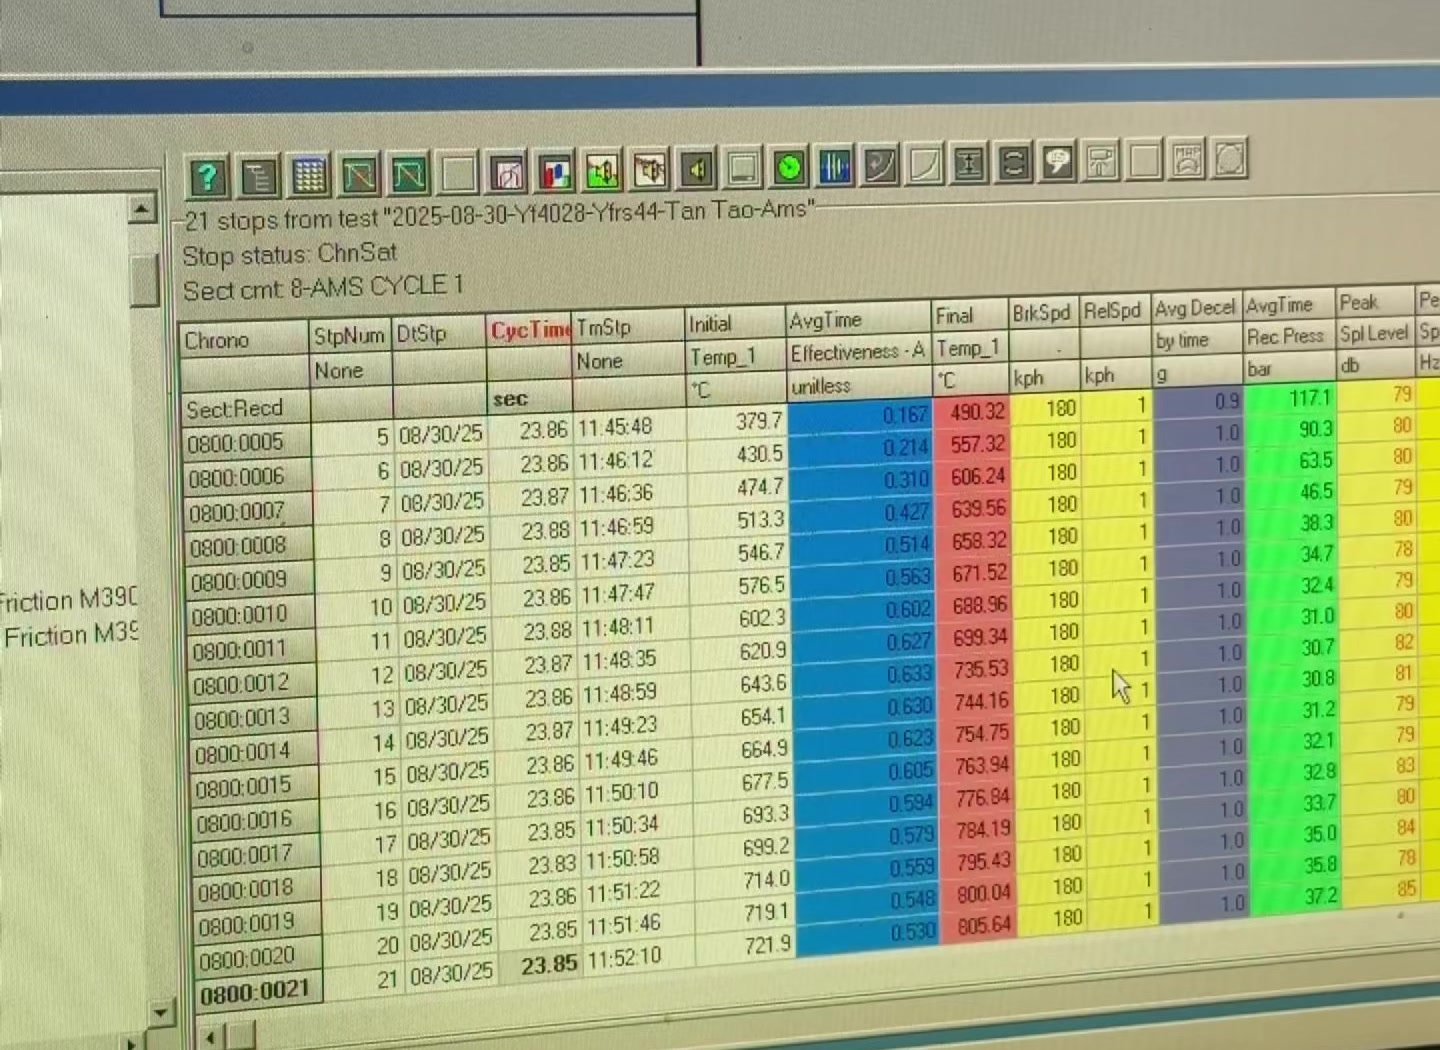
The highest recorded brake pressure came before the hottest part of this test. Stop 5 required 117.1 bar; by stop 14, the display showed 30.8 bar. Later footage shows pressure near 50 bar as the Temp_1 reading approaches 850°C.
Those numbers come from a repeated-stop dynamometer run of an ICOOH IC6 six-piston caliper, a 380 × 34 mm carbon ceramic rotor and CS450 brake pads. The pressure curve is the key to understanding what changed as the assembly heated up.
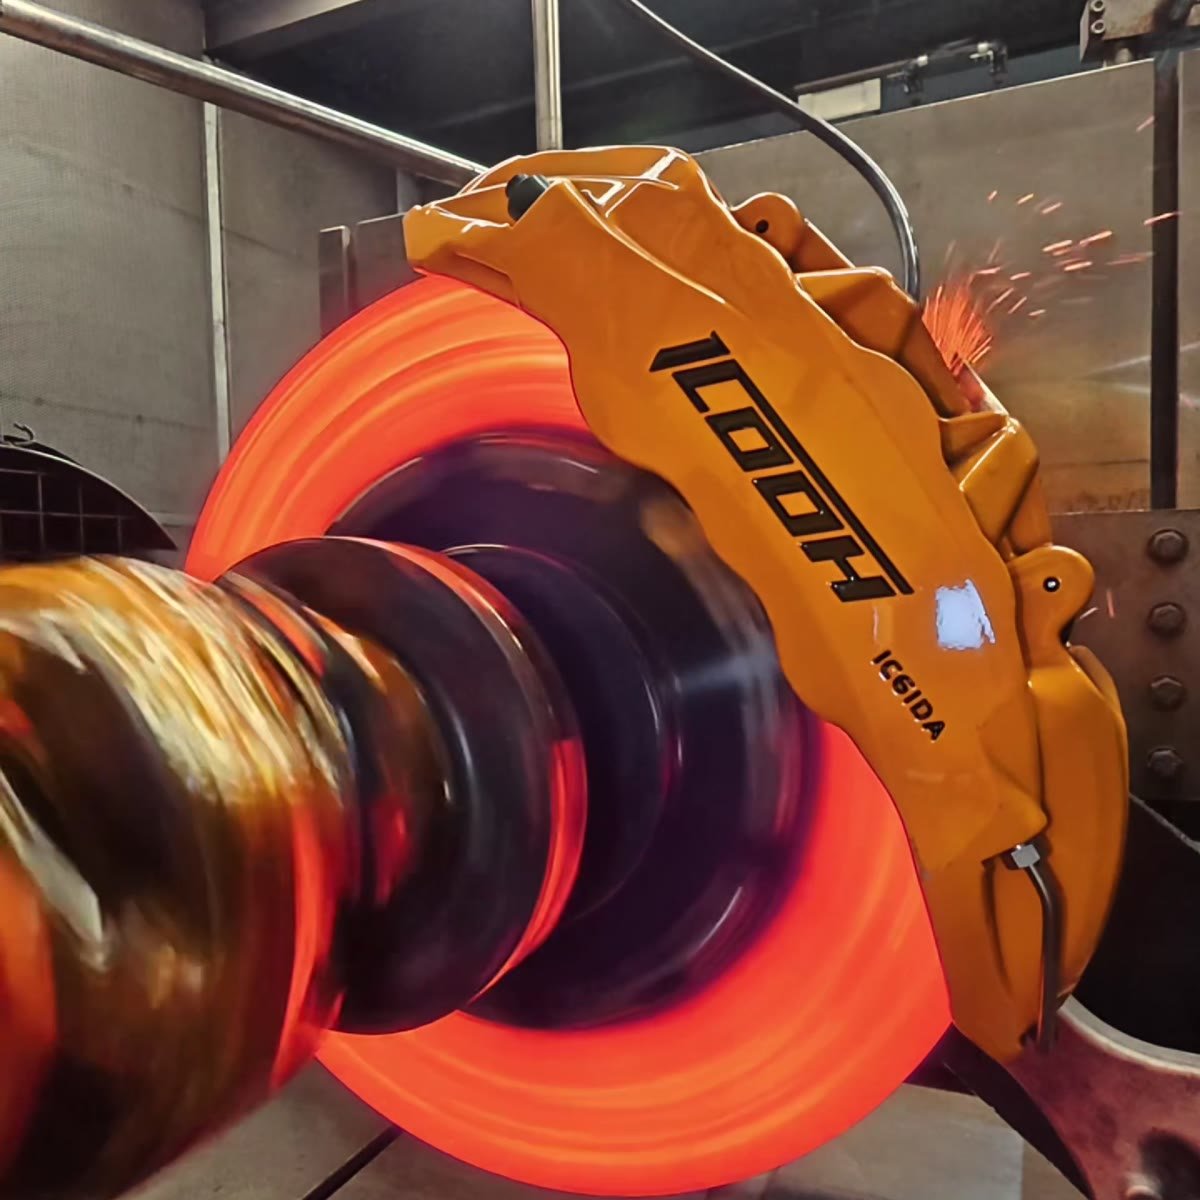
What Was Tested?
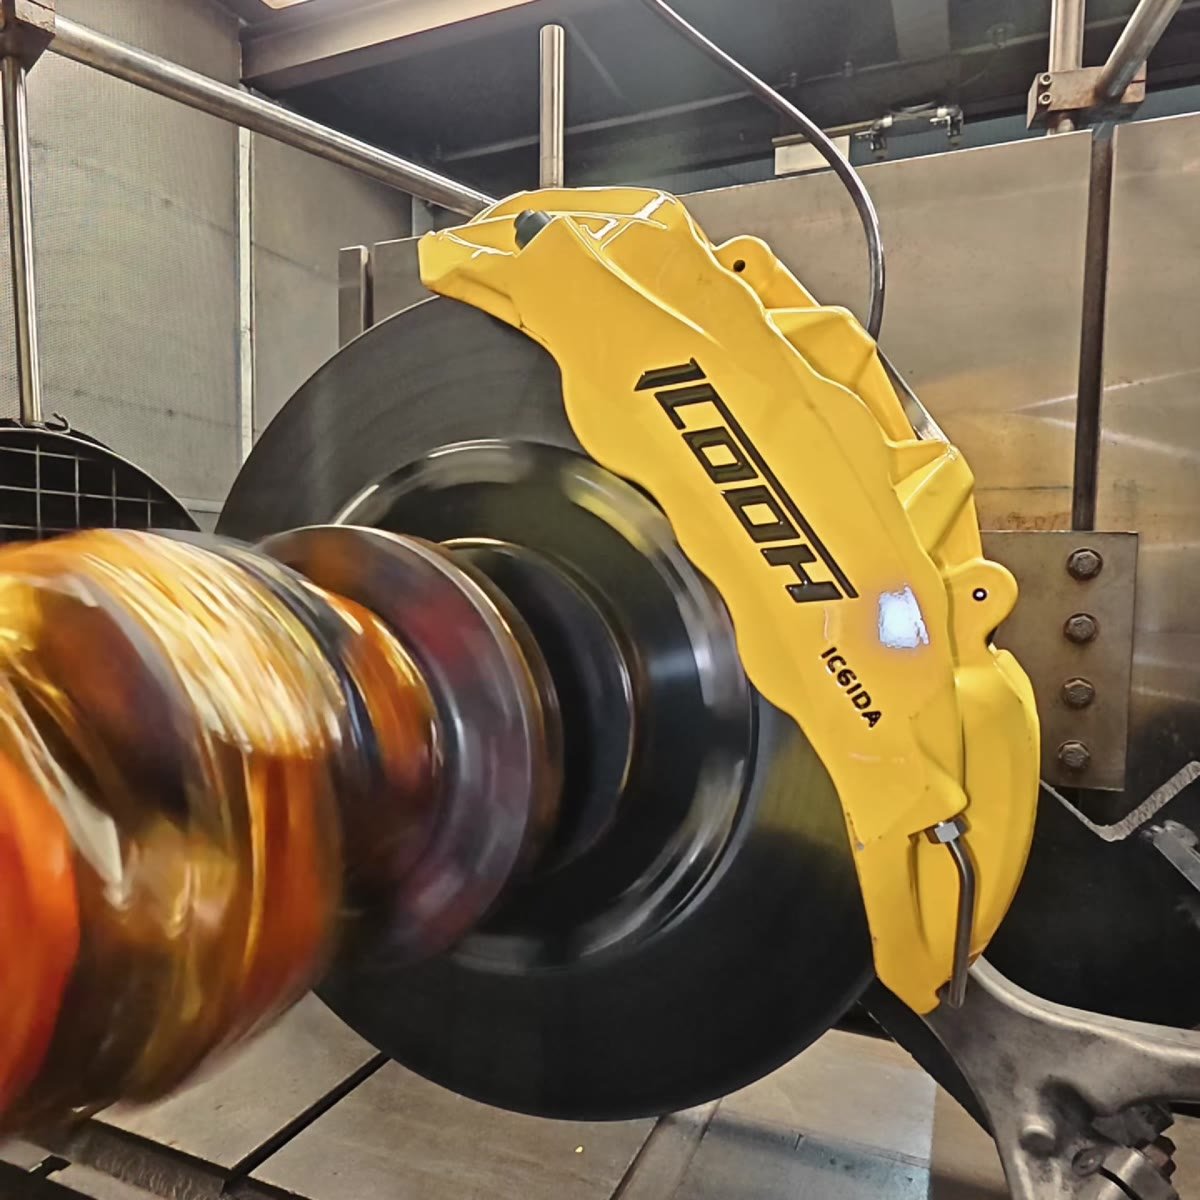
The tested assembly used an IC6 six-piston caliper, a 380 mm diameter and 34 mm thick carbon ceramic rotor, and CS450 pads. These specifications identify the hardware in this run; the data describe the complete brake assembly.
| Recorded setup | What the display shows |
|---|---|
| Run length | 30 braking records in the test footage. |
| Speed range | BrkSpd 180 km/h to RelSpd 1 km/h on the visible records. |
| Deceleration | Most clearly visible rows show Avg Decel en 1.0 g. Stop 5 shows 0.9 g. |
| Cycle timing | Visible CycTime values are approximately 23.8–23.9 seconds. |
| Cooling display | A later screen shows an Air Speed field near 34 kilómetros por hora. The airflow at the brake assembly is not specified by the footage. |
El CycTime field describes the software’s cycle timing; it should not be read as a measured cooling period. The location of the Temp_1 sensor is also needed before its reading can be described as rotor surface, almohadilla, caliper or fluid temperature.
Why Does Temperature Rise During Repeated Stops?
Each stop removes kinetic energy from the rotating test assembly. Much of that energy becomes heat at the pad and rotor interface. Kinetic energy rises with the square of speed, so a stop from 180 km/h puts a substantial thermal load into the brake. When stops are repeated, the next event can begin while the assembly is still warm.
The display shows that accumulation clearly: the initial Temp_1 reading was 27.6°C before stop 1 and 654.1°C before stop 14. The exact heat flow depends on the dynamometer’s inertia, braking schedule and cooling arrangement, which are separate from the values visible in the stills.
How to Read the Carbon Ceramic Brake Test Screen
Four fields explain most of the result. Final Temp_1 is the temperature channel at the end of a stop. Avg Decel is the measured average deceleration. Rec Press is recorded hydraulic pressure in bar. Effectiveness-A is the software’s effectiveness index; its calculation has not been provided, so the values below are reported under their original field name rather than as a friction coefficient.
Four Phases of the 30-Stop Brake Test
| Phase | Final Temp_1 | Effectiveness-A | Rec Press | What the record shows |
|---|---|---|---|---|
| Stop 1: initial stop | 116.77°C | 0.410 | 47.9 bar | The stop began at 27.6°C and reached a displayed average deceleration of 1.0 g. |
| Stops 4–5: early low point | 412.35 → 490.32°C | 0.198 → 0.167 | 99.4 → 117.1 bar | The index fell while pressure demand rose. Stop 5’s deceleration was 0.9 g; stop 4’s was 1.0 g. |
| Stops 6–14: middle-run rise | 557.32 → 744.16°C | 0.214 → 0.630 | 90.3 → 30.8 bar | By stop 14, recorded pressure was about 26% of stop 5’s value, alongside a higher effectiveness reading. |
| Later footage: hotter stage | Temp_1 near 850°C | A reading near 0.427 appears | A reading near 50 bar appears | The later display shows pressure rising again after the middle-run low. These approximate readings are taken from video frames, not a row-level export. |
Stop 5 is the highest-pressure point among the clearly legible early records. It occurred when Final Temp_1 was below 500°C. The later near-850°C footage shows a different operating point, which is why peak temperature alone misses the shape of this run.
Why Can Lower Effectiveness Require Higher Pressure?
Brake torque depends principally on friction at the pad and rotor, clamping force and effective rotor radius. In a hydraulic caliper, greater line pressure generally increases clamping force. If the friction pair generates less torque for a given clamp load, the system must apply more pressure to produce a comparable braking response.
That relationship gives the pressure curve its meaning. Stop 5 displayed Effectiveness-A de 0.167 with 117.1 bar; stop 14 displayed 0.630 with 30.8 bar. These are observations from different stops, not a controlled equal-deceleration comparison: the screen shows 0.9 g at stop 5 y 1.0 g at stop 14. The data establish a large change in pressure demand, while the causes of the change require further material and test-condition data.
Brake fade describes a loss of braking effectiveness under thermal load. Rising pressure alone does not mean the brake has stopped working. It is a signal to examine deceleration and pressure together: if maintaining the requested deceleration takes progressively more pressure, the system’s response has changed.
ICOOH lists a nominal 100–1100°C working range for the CS450 pad. The later Temp_1 reading near 850°C lies numerically inside that stated range. Because the sensor location has not been identified, the reading cannot be treated as the pad’s own temperature.
What Would Similar Changes Feel Like in a Vehicle?
A dynamometer controls a braking event directly. A driver senses the system through the pedal and vehicle response. These two observations are especially useful when interpreting a real car’s braking behavior:
| What the driver notices | Que comprobar |
|---|---|
| Pedal remains firm, but the same slowing requires more effort | Record when the change appears and whether it tracks repeated braking. Pad and rotor friction behavior is one possible contributor; the pressure rise in this test illustrates why the symptom matters. |
| Pedal becomes longer or soft as the brakes heat | Inspect fluid condition and the hydraulic system. Vapor in overheated brake fluid can make the pedal soft or allow it to travel farther. |
Test-bench pressure does not translate directly into driver pedal force. On a vehicle, pedal leverage, the brake booster, master cylinder and hydraulic layout determine how a driver’s input becomes line pressure.
What the 30-Stop Test Establishes
This IC6, carbon ceramic rotor and CS450 combination completed the recorded repeated-stop sequence. The visible data show a pronounced early pressure peak, a middle-run pressure low and a later rise as Temp_1 approached 850°C. That is a measurable change in response across the run, even though the brake continued to produce deceleration.
For a workshop explaining this result to a customer: the hottest displayed point was not the hardest recorded point for the brake to meet. Stop 5 demanded 117.1 bar at 0.9 g; stop 14 showed 30.8 bar at 1.0 g.
These images document one bench sequence. They do not provide a road stopping distance, long-term durability result or direct measurements of pad, fluid and wheel temperature. A complete report would identify the Temp_1 sensor, define Effectiveness-A, state the dynamometer inertia and airflow conditions, and include the 30-row export.
Preguntas frecuentes
Will a carbon ceramic brake work when cold?
It did in the first recorded stop of this test. Stop 1 began with Temp_1 at 27.6°C and recorded 1.0 g average deceleration at 47.9 bar. The CS450 pad’s stated 100°C lower working-range figure does not imply zero braking below that number; this first stop is a direct observation for the tested assembly.
Does rising brake pressure always mean brake fade?
No. Pressure tells you how much hydraulic input the system used. Compare it with deceleration and the effectiveness reading across successive stops. A rising pressure requirement for the same requested braking response is evidence of a changing system response, but the underlying cause needs its own diagnosis.
Does a Temp_1 reading near 850°C mean the fluid or wheels reached 850°C?
No. Temp_1 is one temperature channel, and its measurement point has not been identified. Brake fluid and wheel temperatures require their own measurements. In a vehicle, a softening pedal during repeated braking is a reason to check the fluid and hydraulic system promptly.
Can the recorded bench pressure be converted to pedal force in a car?
Not directly. El 117.1 bar and 30.8 bar values are hydraulic readings from this dynamometer sequence. Pedal ratio, booster assistance and master-cylinder sizing determine what pedal force would produce a given pressure in a specific vehicle.
Fuentes & Referencias técnicas
- ICOOH IC6 repeated-stop dynamometer footage — original test video; the stills used above come from this recording.
- ICOOH CS-series brake pad specifications — published CS450 nominal working-temperature range. This reference supplies a pad specification, not a result from the bench test.
- Brembo brake-fluid technical guidance — effect of vapor formation on pedal travel and feel.
- Bosch Mobility: Tandem Master Cylinder — how pedal input and booster assistance are converted to hydraulic pressure.
For hardware details, see the ICOOH IC6 carbon ceramic brake kit. For the full test record or technical documentation, contact ICOOH.