
Brake Systems 101 — Dynamometer Test Data
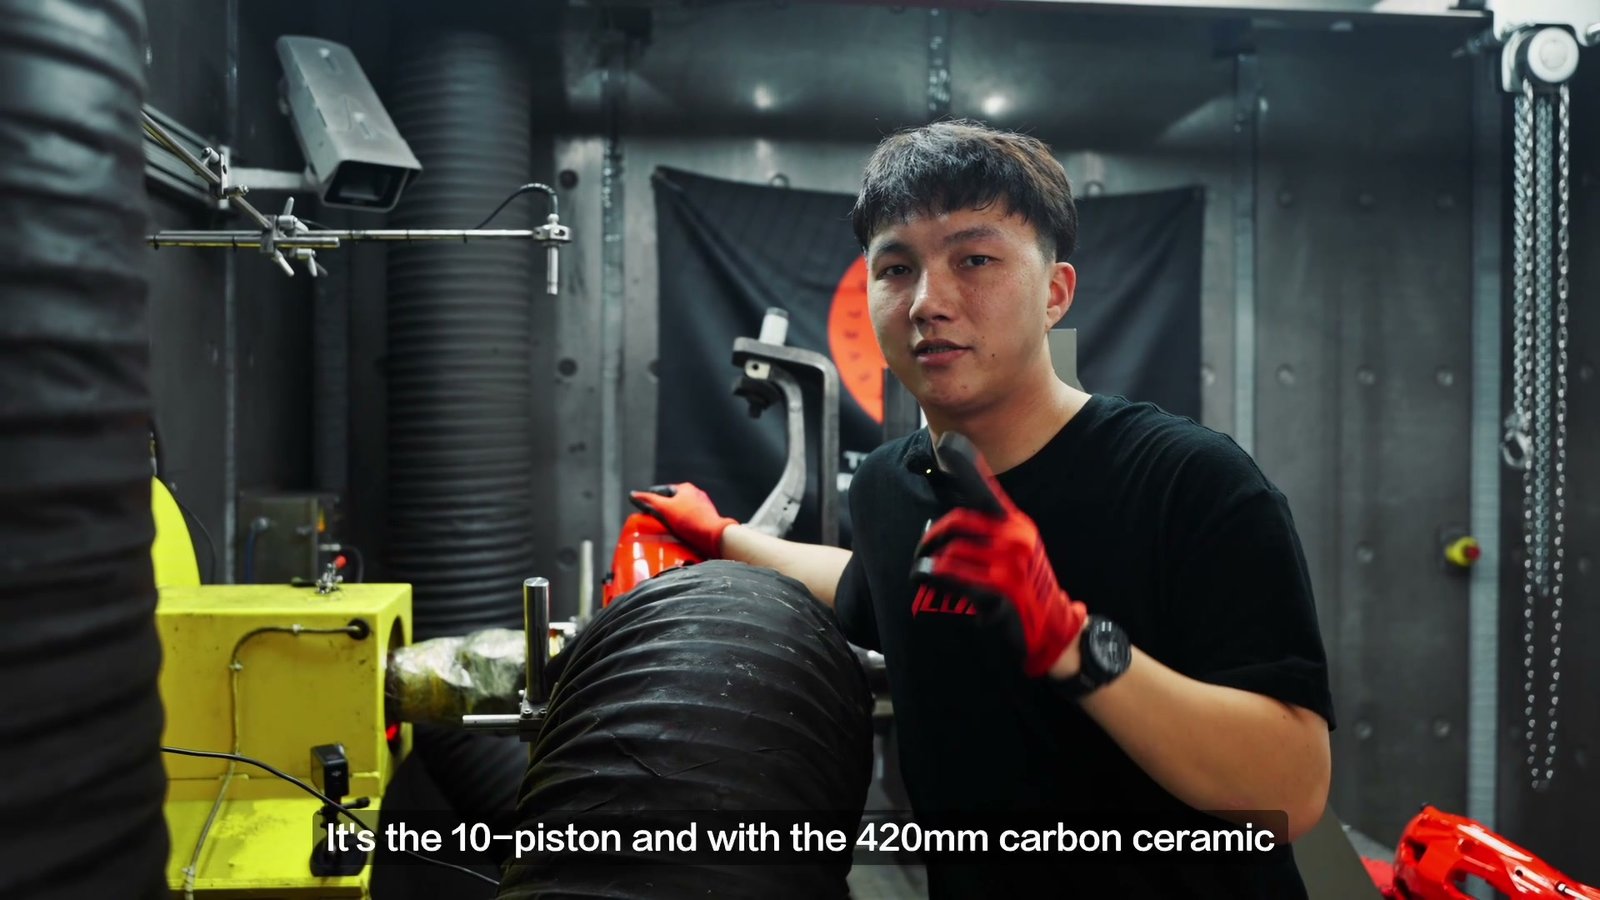
On July 16, 2026, ICOOH recorded a repeated-stop dynamometer test of an IC10 ten-piston caliper with a 420 × 32 mm carbon ceramic rotor and CS400 brake pads. The video numbers ten braking cycles. Its clearest result is in the first eight instrument rows: average deceleration stayed close to 0.40 g, while the pressure-control reading rose from 34.8 bar at stop 3 to 43.8 bar at stop 8.
The temperature channel also climbed. Its maximum reading was 547.11°C at stop 3 and 740.65°C at stop 8. A later graph shows 853.5°C during stop 9, and the edited video labels stop 10 at about 860°C. The final two temperatures are shown in the footage, but full instrument rows for those stops are not visible.
PressCtrl increased by about 26% for a similar recorded response. That pressure change is the main finding to examine alongside the rising temperature.
What Was Tested?
| Test detail | What the record shows |
|---|---|
| Brake assembly | IC10 ten-piston caliper, 420 × 32 mm carbon ceramic rotor, CS400 pads. |
| Record date | July 16, 2026, as displayed in the dynamometer table. |
| Braking sequence | Ten numbered stops in the video; complete values for stops 1–8 are readable together. |
| Speed | The presenter describes braking from 180 km/h to zero; recorded maximum speeds for stops 1–8 are 180.063–180.108 km/h. |
| Recorded average deceleration | 0.39965–0.40095 g across stops 1–8. |
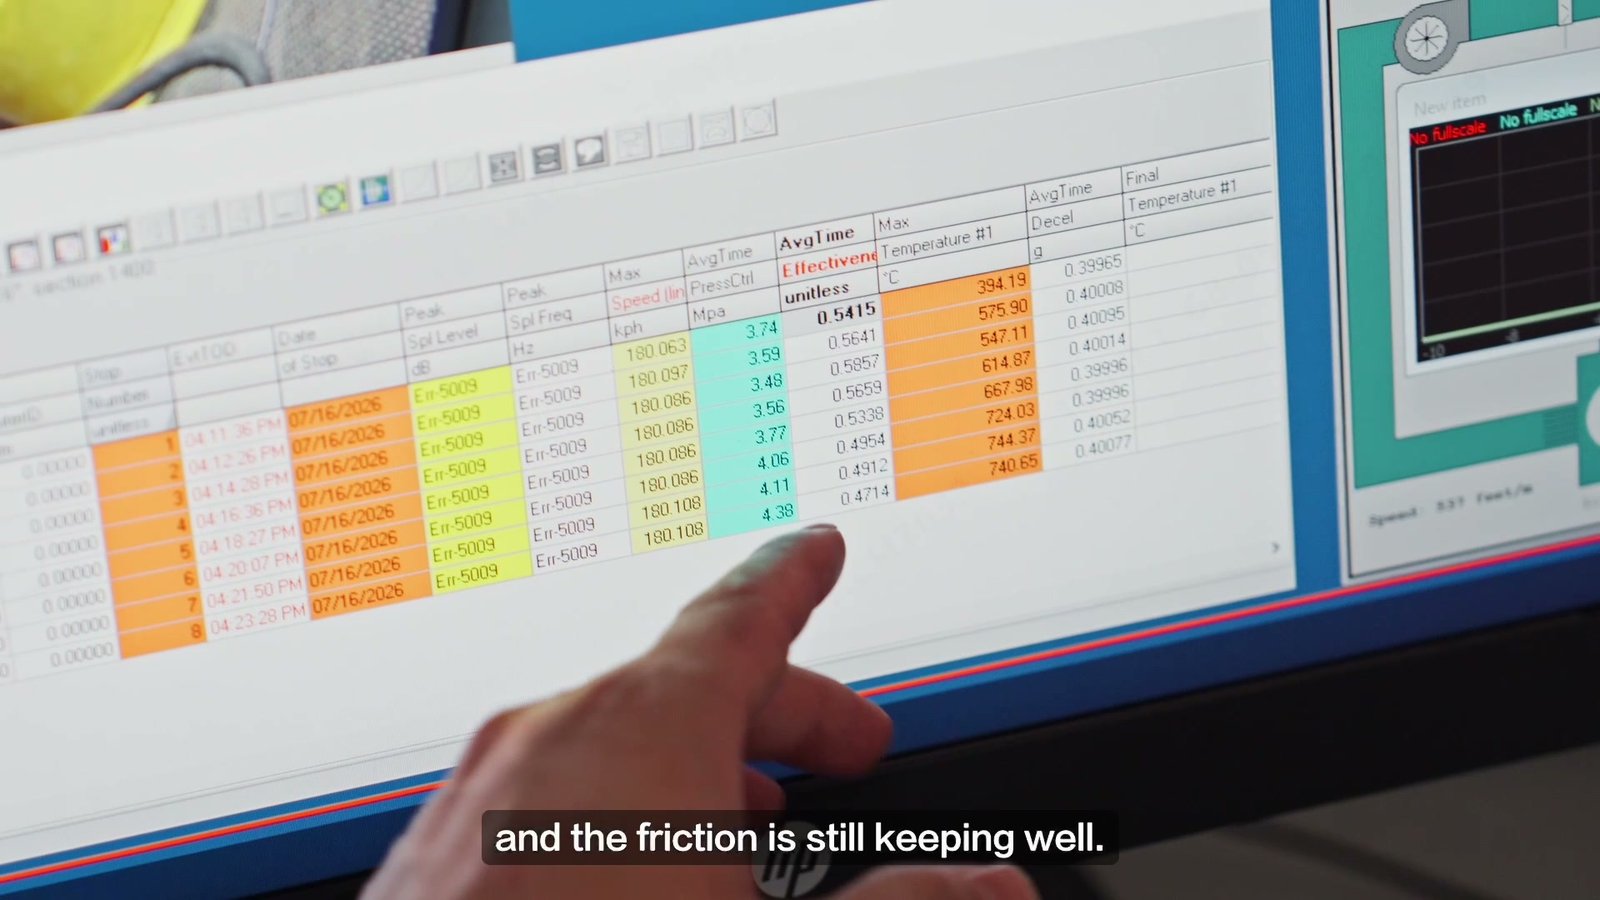
The screen labels the relevant columns Max Temperature #1, AvgTime PressCtrl and AvgTime Decel. Temperature #1 is a numbered measurement channel; its sensor position is not specified in the video. PressCtrl is the software’s pressure-control field in MPa. The table below also converts it to bar, using 1 MPa = 10 bar.
Why Does a 0.40 g Test Generate So Much Heat?
A dynamometer spins an assembly up to speed and then uses the brake to remove its rotational energy. Much of that energy becomes heat at the pad and rotor interface. For a fixed test inertia, energy scales with the square of speed. Repeating high-speed stops can therefore raise component temperatures even when the recorded deceleration is well below 1.0 g.
A simple calculation puts 0.40 g in context. At constant 0.40 g deceleration, slowing from 180 km/h to zero takes about 12.7 seconds. The corresponding idealized vehicle travel distance would be about 319 meters. Neither number is a measured result from this dynamometer; the calculation illustrates the longer braking duration associated with a lower deceleration. For the same initial and final speed and the same effective inertia, changing deceleration mainly changes how quickly the energy is removed, rather than the initial energy available to dissipate.
The video does not explain why this particular program used approximately 0.40 g. That matters when reading the result: it is a repeated-braking test at the recorded load, not a maximum-deceleration test or a road stopping-distance measurement.
The First Eight Stops: Temperature, Pressure and Deceleration
| Stop | Max Temperature #1 | AvgTime PressCtrl | Converted pressure | AvgTime Decel |
|---|---|---|---|---|
| 1 | 394.19°C | 3.74 MPa | 37.4 bar | 0.39965 g |
| 2 | 575.90°C | 3.59 MPa | 35.9 bar | 0.40008 g |
| 3 | 547.11°C | 3.48 MPa | 34.8 bar | 0.40095 g |
| 4 | 614.87°C | 3.56 MPa | 35.6 bar | 0.40014 g |
| 5 | 667.98°C | 3.77 MPa | 37.7 bar | 0.39996 g |
| 6 | 724.03°C | 4.06 MPa | 40.6 bar | 0.39996 g |
| 7 | 744.37°C | 4.11 MPa | 41.1 bar | 0.40052 g |
| 8 | 740.65°C | 4.38 MPa | 43.8 bar | 0.40077 g |
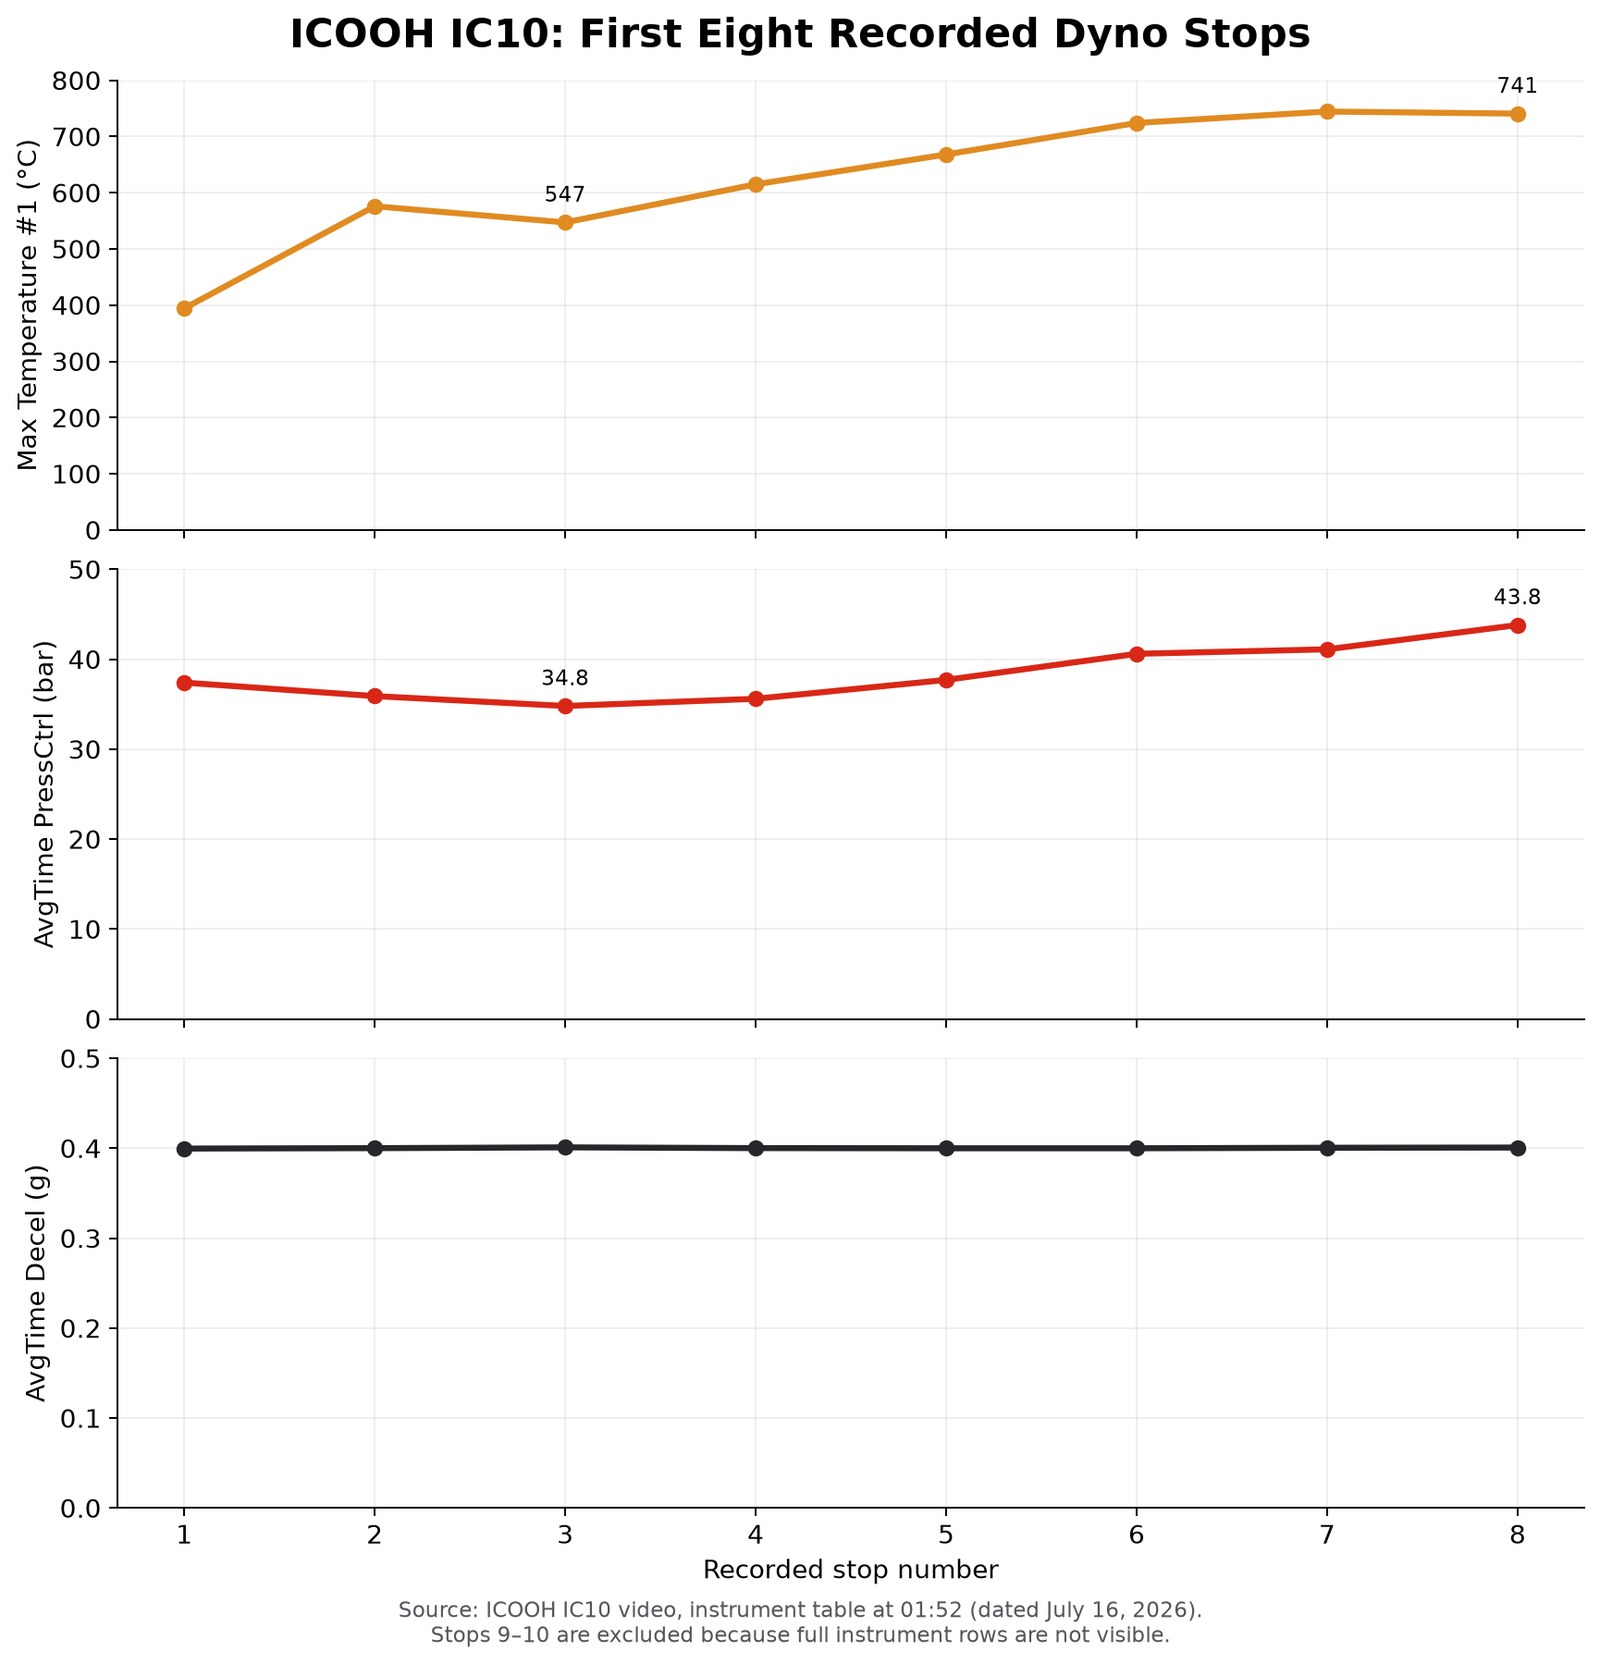
The temperature trace has small reversals: stop 3 is cooler than stop 2, and stop 8 is slightly cooler than stop 7. The pressure trend is clearer after stop 3. It rises from 3.48 to 4.38 MPa, or 34.8 to 43.8 bar, while average deceleration changes only from 0.40095 to 0.40077 g. The 9.0 bar increase is approximately 25.9% of the stop-3 value.
This means the controller needed more pressure to sustain roughly the same recorded deceleration later in the sequence. The observations describe a change in the assembly’s pressure-to-deceleration response. They do not identify a single cause. Pad and rotor friction behavior, test control, temperature distribution and other conditions would need separate measurements to isolate the mechanism.
Is That Brake Fade?
Brake fade is a reduction in braking response during demanding use, often associated with heat. A useful way to detect a change is to compare the deceleration produced for a given pressure across successive stops. SAE paper 2005-01-0790 describes pressure-to-deceleration gain for assessing brake response during high-energy track driving. It is a reference for the measurement concept; this IC10 test was performed on a dynamometer.
In the readable IC10 rows, rising PressCtrl and nearly constant deceleration show reduced pressure-to-deceleration response after stop 3. The brakes still produced the recorded 0.40 g; the pressure requirement changed. Calling the underlying cause “thermal fade” would require more than these three channels, because the footage does not document pad temperature, the Temperature #1 sensor location, cooling conditions or the full controller definition.
What Do the Ninth and Tenth Stops Add?
During stop 9, the filmed graph reads Temperature #1: 853.5°C. The video then labels stop 10 at approximately 860°C. These frames show that the numbered temperature channel reached a higher range later in the sequence.
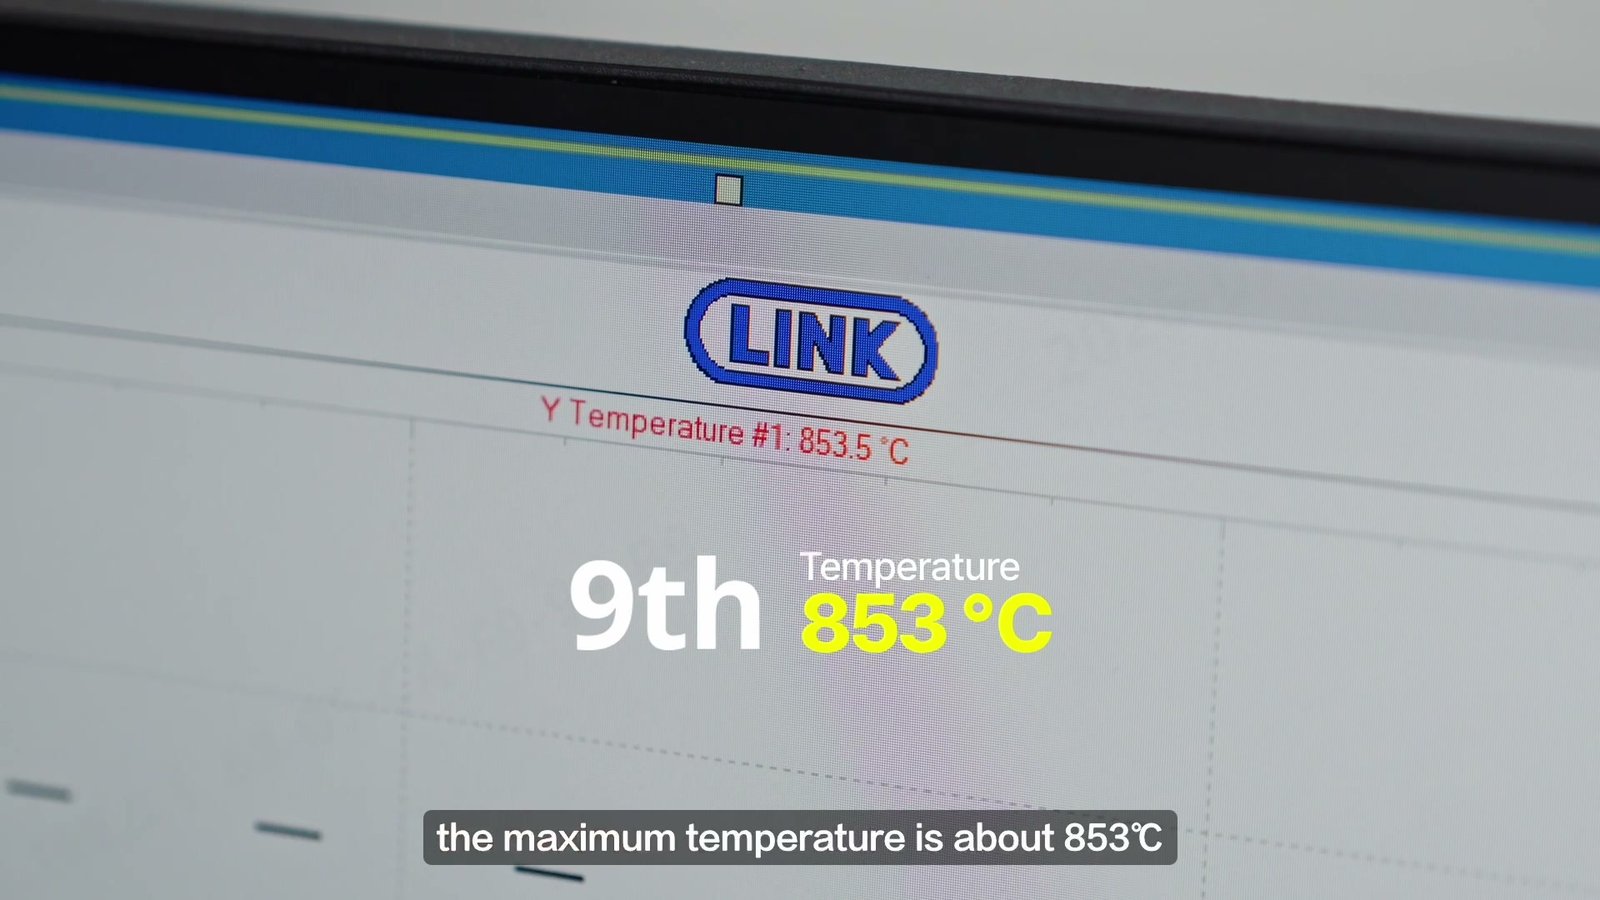
ICOOH’s CS-series pad specification lists a nominal 100–900°C operating range for CS400. The video readings of 853.5°C and about 860°C are numerically near that upper figure. The comparison is contextual: a Temperature #1 reading cannot be treated as the CS400 pad temperature until the measurement point is identified. The footage also does not show pressure and deceleration in complete rows for stops 9 and 10, so the eight-row pressure trend should not be extended to them.
What Is the Result a Reader Can Take Away?
This IC10, carbon ceramic rotor and CS400 combination completed the ten numbered events shown in the video. Across the eight fully readable instrument rows, average deceleration remained near 0.40 g. Between stops 3 and 8, the pressure-control value rose 25.9%, from 34.8 to 43.8 bar, while the recorded temperature channel moved from 547.11°C to 740.65°C.
Across stops 3–8, the test held approximately 0.40 g average deceleration while the pressure-control reading rose by 9.0 bar. That is the change documented by the row-level data.
The later frames add a higher Temperature #1 reading, not a complete pressure-and-deceleration curve. Real-car stopping distance, pedal effort and long-term durability require their own tests. A full ten-stop report would add the final two rows and state the sensor position, dynamometer inertia and cooling conditions.
Frequently Asked Questions
Why Was the Recorded Deceleration About 0.40 g Rather Than 1.0 g?
The footage does not state the reason for the program setting. At 0.40 g, braking from 180 km/h lasts longer than it would at 1.0 g under the same idealized assumptions. For a fixed test inertia and the same speed reduction, the initial energy to remove is comparable; the rate and duration of braking change. The IC10 and earlier IC6 results therefore describe different test demands.
Did the IC10 Brakes Fail When the Temperature Channel Reached About 860°C?
The first eight full rows show sustained deceleration near 0.40 g. The later footage shows a temperature reading near 860°C but does not display complete pressure and deceleration values for stop 10. The video supports a high displayed temperature, while the braking response at that exact stop needs its full instrument row.
Does a Rising Pressure Value Automatically Mean Brake Fade?
It shows that more control-pressure input was used for a similar recorded deceleration. That is a measurable reduction in pressure-to-deceleration response across stops 3–8. The data alone do not establish whether the cause was the pad, rotor, thermal distribution or another test condition.
Does 860°C Mean the CS400 Pad, Caliper or Brake Fluid Reached 860°C?
No component temperature can be assigned from the channel name alone. The screen calls it Temperature #1, without identifying the sensor location. The CS400 specification’s 900°C upper operating-range figure is a pad specification, so it cannot be directly compared with an unidentified measurement point.
Can This Test Be Compared Directly With ICOOH’s IC6 Dynamometer Test?
The two articles can be read together, but their pressure numbers are not a direct head-to-head result. The IC6 test used a six-piston caliper, 380 × 34 mm rotor and CS450 pads, with most visible stops near 1.0 g. Its screen reports Rec Press in bar; this IC10 screen reports PressCtrl in MPa at about 0.40 g. Comparing products would require a shared procedure, inertia, cooling and measurement definitions.
Sources & Test Record
- ICOOH IC10 original dynamometer video — assembly identification at 00:22, eight-row instrument table at about 01:52, and ninth-stop temperature graph at about 02:10. The table is dated July 16, 2026.
- ICOOH CS-series brake-pad specification — CS400 nominal 100–900°C operating range. This identifies the pad’s published range, not the location of the test’s Temperature #1 sensor.
- SAE technical paper 2005-01-0790 — pressure-to-deceleration gain as a way to characterize brake response in high-energy driving.